Menu

DISCLAIMER: By reading or otherwise using any of the information presented on this page, you agree to and accept the following. Otherwise, please stop now and leave or close this page. 

  1. The information on this page is NOT ABSOLUTE and is presented as the OPINION and EXPERIENCE of the writer, based on their personal experiences with multiple flood and near-flood events that threatened  and / or inundated Simonton’s Valley Lodge Subdivision.
  2. The information on this page is intended to help fellow Simonton residents  to understand and interpret the river levels on their own as this information is presented, intended, and anticipated to be used to be used for information purposes ONLY.
  3. All readers of this page are responsible for their own safety and that of their loved ones. 
  4. If any reader of this page feels unsafe at any time for any reason including related to the possibility or likelihood of flooding, it is up to them to take any actions that they feel are necessary to prepare, act, and react to any flood-related question, possibility, probability, or event as they see fit.
  5. Use this information ONLY AT YOUR OWN RISK. You have been warned!

River Forecast Map from the National Weather Prediction Service

Map View

If you want to track the various gauges throughout the region, simply click on THIS LINK to the National Weather Prediction Service.

What to do?

Simply locate and click on the gauge that you want to see more data on. 

Note that the relative gauges for our area are: Hempstead, San Filipe, and Richmond.

Simonton's Local Data Point from the Harris County Flood Warning System

Local Data Point

The Harris County Flood Control District monitors the level of the Brazos River via a radar sensor that is located on the Brazos River Bridge on FM 1489, 3 miles south of Downtown Simonton.

Click HERE to review the data provided by this gauge.

This gauge is just below Simonton, making it perhaps the most accurate gauge that will tell you specifically what the river is doing at any given time.

There is no graph attached to the gauge and it is not “connected” in any way to the data from the National Weather Service Prediction Service, it is still highly useful to anyone that wants to track the actual data.

The US Army Corps of Engineers Brazos River Dashboard

Corps of Engineers 

The Corps of Engineers is tasked with monitoring the Brazos River as well as maintaining certain infrastructure along its path.

Click HERE to visit the The US Army Corps of Engineers Brazos River Dashboard.

This page combines a number of very important elements to provide visitors with a broad view of the status of the Brazos River.

Brazos River Flood Gauges and Information

Hempstead, TX is “above” Simonton. Although the “flow” of  the river will vary depending on many factors, it generally takes 16-24 hours before a rise, fall, or crest that occurs in Hempstead is reflected in Simonton.

You’ll note that the “flood stage” indicated in Hempstead is 50′.  This level “translates” to a flood stage level that will end up shown arriving in Richmond , TX and will be reflected as roughly 48′ there. This level will appear in Simonton as “bank full”, meaning beyond that, the river will exceed its banks.

Stated more simply, if you see the river crest at or above 50′ in Hempstead, that water will likely arrive within 16-24 hours at or above the “bank full” level at Valley Lodge.  

Like Hempstead, TX, San Filepe is “above” Simonton.

This gauge is roughly 8-14 hours ahead of Simonton. Levels seen here will be reflected mere hours before they impact our community. The levels indicated are useful to confirm the flows coming from Hempstead.

Presently, the stated level of the gauge at San Filepe, TX has no simple, direct numeric correlation to the river levels stated for Hempstead, TX or Richmond, TX, as relates to Simonton. That being said, the gauge is useful in detecting, monitoring, and anticipating any rise, fall, and crest of approaching river levels.

Richmond, TX is downstream and that leaves their graph showing flows that passed through Simonton up to 18-24 hours prior. Consequently, river levels in Richmond reflect the water level that has already passed Simonton by a significant amount of time.

This gauge is most useful to confirm that an upcoming crest has arrived or fallen.

Interestingly, the flow of the Brazos will vary based on the type of flooding or river flow, tides, wind, obstructions, the speed of area drainage over time, and of course ongoing rainfall.

For example, if there is significant rainfall below Simonton, that water will act as a dam and cause the river to “pile up” on itself. This phenomenon is important to understand and could mean that river flows will slow locally and cause upstream flows to exacerbate an already bad local situation. So, simply watching the river levels in Richmond may not be the most accurate method of predicting a flood stage at Simonton. One must take these factors into account when judging or anticipating local river levels.

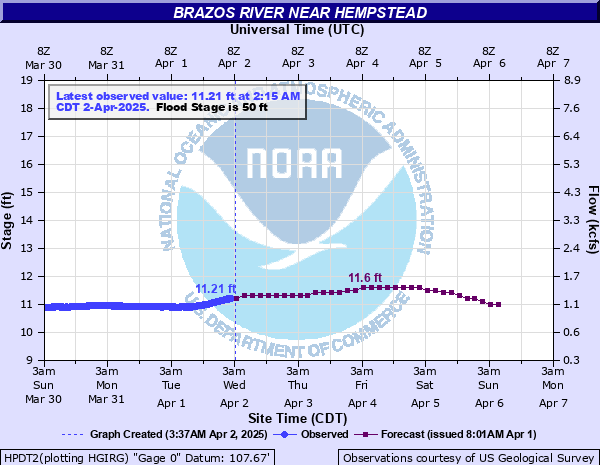
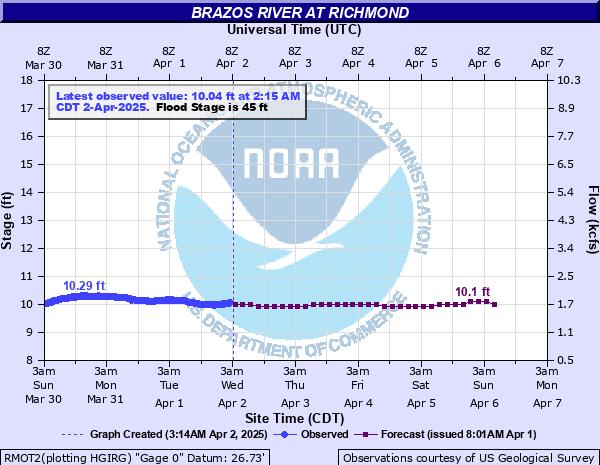
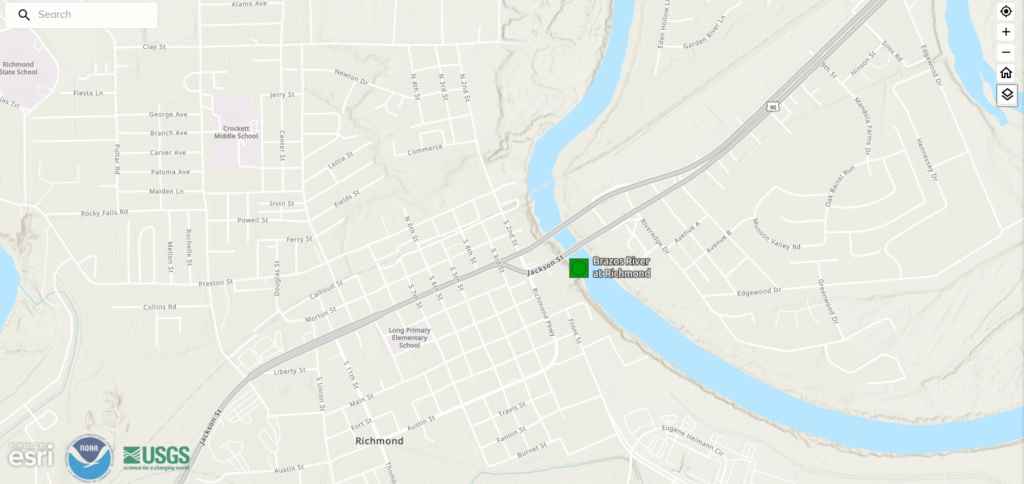
Downstream development can slow the flow of the Brazos river as it flows through Simonton and it can do so in the same way as downstream rainfall does.

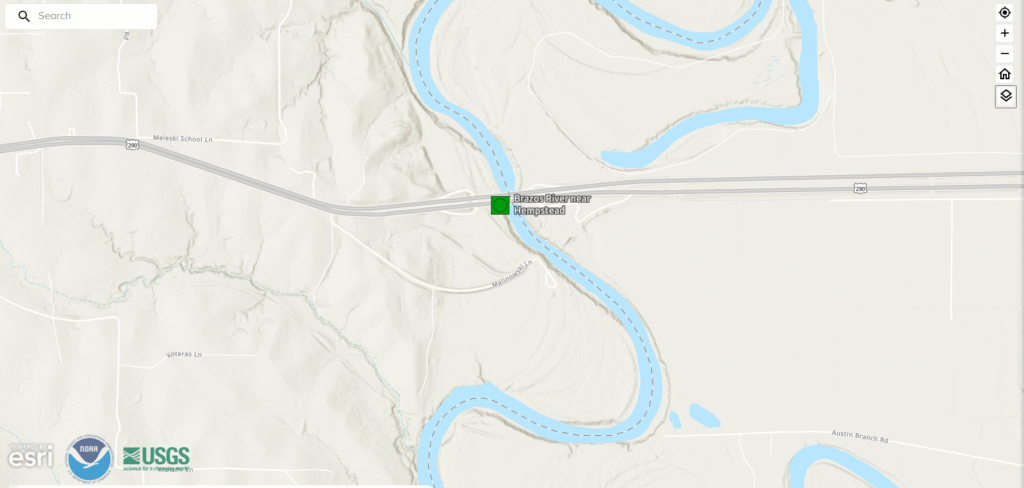
Click for the Fort Bend County Interactive Map showing all levees in Fort Bend County.

The Impact of Levees

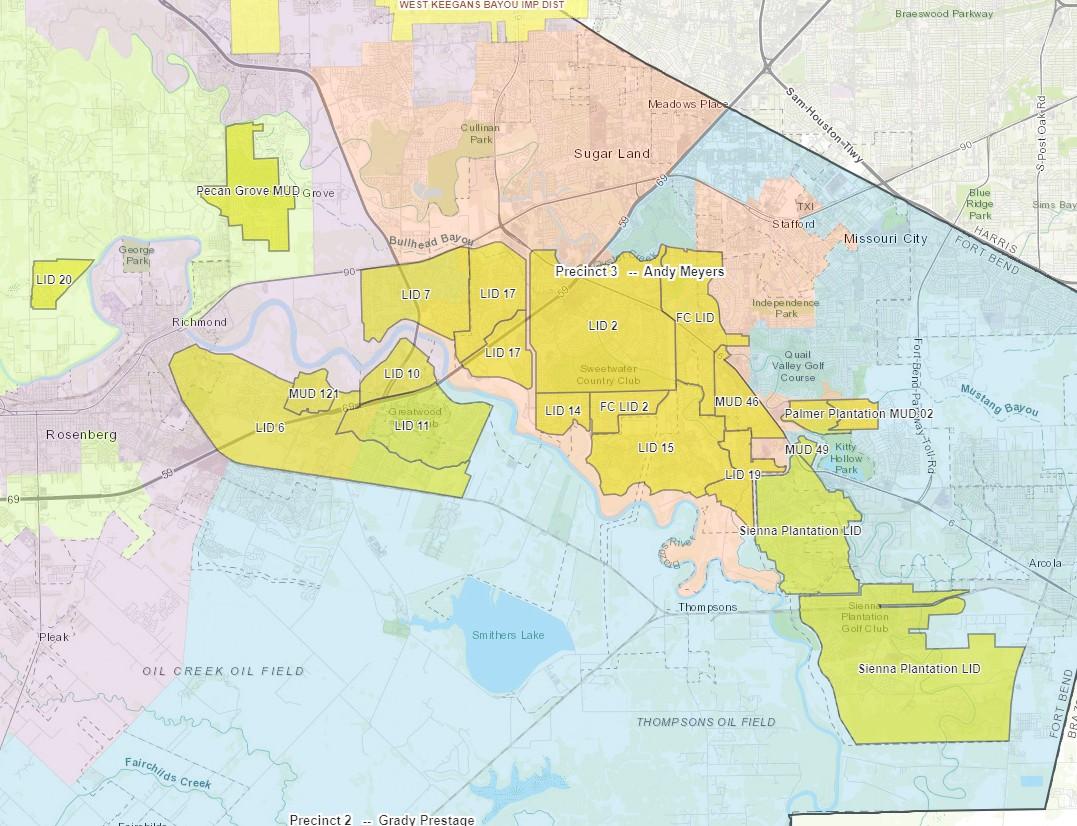
Downstream Levee Improvement Districts (LID’s) approved and built over the last 30-40 years act as barriers to flow when the river rises. In a flood event, these artificial dams force the river to re-route from its natural course and consequently force the river to slow down as well as to spread flood water out as it seeks the most direct course around the subdivisions or areas that they are intended to protect.

This has the effect of “log-jamming” the downstream flow and forcing oncoming upstream flows to pile up on themselves. This is one way that Simonton’s flood risk has quietly increased over the years.

Other Impacts

Beyond the impact of LID’s, the fact that commercial and residential development in Fort Bend County is increasing should raise concern for any Simonton resident. After all, even with the Fort Bend County Drainage District and local cities requiring retention and detention to offset these developments, their runoff has to end up going to the Brazos River at some point. The trouble is that once a detention pond is full to ground level, it has very little benefit to controlling flooding as we learned in the historic flood event that came out of of 2017’s Hurricane Harvey.

So, even with flood control being baked into the flood development permitting process, our present useful level of flood control is limited to a minor to moderate rain event.

Even with new communities that are not protected by levees, which seem to come on-line every month and appear with increasing frequency, there will always be a commensurately increasing need to better manage our area’s resulting runoff and drainage to and away from many new communities.

The bottom line is that while upstream flows are a prime threat and risk of flooding in Simonton, our city will likely have to contend with the impacts from downstream development for many years to come. After all, there is no sign of downstream development slowing any time soon.